I’m curious, does the fuel efficiency graph of real engines maintain the same shape regardless of throttle position? That is, would it be most economical to cruise with the engine at a light throttle and appropriate gearing such that the RPMs are at the ‘most efficient’ RPM range, rather than simply the lowest RPMs that don’t require heavy throttle to maintain speed?
While I’m not an engineer, I think the answer to your question is sort of, and then no.
My impression is that the efficiency curve of the engine must be interpreted only in isolation i.e. the engine as a standalone unit, where the efficiency is mainly the product of the timing of combustion relative to the cycle plus how hard the engine has to work to maintain that rpm. Of course, if you apply less throttle, you use less fuel, but then the rpm would also change so you can’t really interpret the “curve” from that.
However obviously a car adds mass, a whole lot more friction through the drivetrain and the wheels and wind resistance etc. etc. so the real world answer would be a fair bit fuzzier. In real world terms AFAIK fuel efficiency for cruising would be that added onto the relative amount of power needed relative to the engine’s maximal output you need to apply to maintain that velocity. It’s fairly clear that you do lose efficiency by cruising at too low an rpm in cars biased to high RPM outputs because you’d have to apply more throttle, which is a bit of a gripe I have with my Civic. On the flip side, simply matching the car to maximal efficiency rpm wouldn’t necessarily work either because of frictional losses at a higher rpm. The actual amounts of each I’m not sure of, but I’m fairly sure wind resistance won’t count for very much under freeway speeds 
The efficiency curve in automation is a simplified curve based on one load condition.
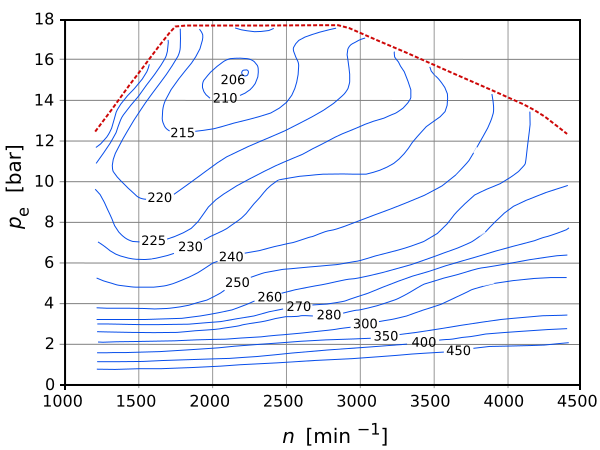
In the real world you use a BSFC (brake specific fuel consumption) map like this

link, the y axis is the engine load, aka throttle position and the x is rpm
So for this example the ideal rpm is around 2200 and and the ideal load in just under 90%, so this is where you want your highway cruising speed.
You know, I saw that chart before but glossed over it for some reason. 
I guess I’m a little confused by the concept of load. In your example you say that ‘ideal load’ is just under 90%, what does that mean in the real world? Does this mean lugging the engine at the optimal RPM is most efficient (at least until the engine overheats)?
That graph is from a diesel engine, 2200 rpm is right after peak torque.
I wasn’t able to find a useful one for a gasoline piston engine on google, this one’s a rotary:

In that case it would be high load at 3000-3500rpm
Load is more or less how open the throttle is.
Piston engines in general tend to be more efficient at higher loads, so yeah, lugging the engine is actually more efficient.
It’s probably worth noting here what the definition of “efficiency” here is. Efficiency in the engine sense, AFAIK, is about what kinetic energy returns you’re getting proportional to the potential energy (i.e. amount of fuel) you’re putting in. Not necessarily what you were probably asking about, which was fuel consumption per unit distance, though in an ideal world (without all the other extraneous factors I mentioned before), they would theoretically be one and the same.


